Mastering the Market: Understanding Candlestick Patterns for Better Trading Decisions in 2025
Candlestick patterns are a key tool for traders looking to make sense of price movements and market trends. These patterns provide insights into market behavior, helping traders anticipate potential price changes. As we head into 2025, understanding candlestick patterns is more important than ever for making informed trading decisions. In this article, we’ll explore the basics of candlestick patterns, key types to watch for, and how to effectively use them in your trading strategy.
Key Takeaways
- Candlestick patterns visually represent price movements and market sentiment.
- Recognizing bullish and bearish patterns can indicate potential market direction.
- Continuation patterns suggest that the current trend is likely to persist.
- Combining candlestick analysis with other indicators can improve decision-making.
- Market conditions, such as trends versus sideways movements, affect the reliability of candlestick patterns.
Understanding Candlestick Patterns in Trading

Defining Candlestick Patterns
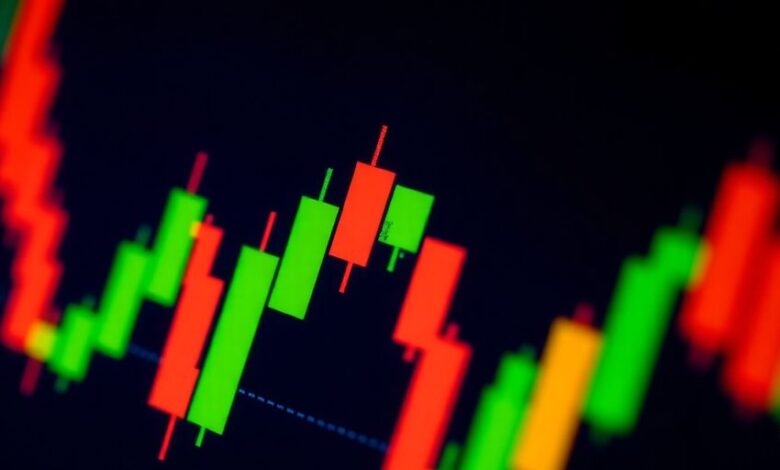
Okay, so what are candlestick patterns? Basically, they’re a way of visualizing price movements over a specific period. Think of them as a shorthand for understanding the battle between buyers and sellers. Each candlestick represents a single period (like a day, an hour, or even a minute) and shows the open, close, high, and low prices for that time. The “body” of the candle shows the range between the open and close, while the “wicks” (or shadows) show the high and low prices. If the closing price is higher than the opening price, the body is usually green (or white), indicating a bullish, or upward, move. If the closing price is lower, the body is red (or black), indicating a bearish, or downward, move. You can find more information on candlestick charts online.
Importance of Candlestick Patterns
Why should you even care about candlestick patterns? Well, they can give you clues about what’s going on in the market. They help traders quickly grasp market sentiment and potential price movements. Instead of just looking at a bunch of numbers, you can see a visual representation of the price action. This can be super helpful for spotting potential trend reversals or continuations. Plus, candlestick patterns are used by traders all over the world, so understanding them can help you understand how others are viewing the market. Here’s a quick rundown of why they matter:
- They provide a visual representation of price action.
- They help identify potential trend reversals.
- They offer insights into market sentiment.
How Candlestick Patterns Reflect Market Sentiment
Candlestick patterns aren’t just about numbers; they’re about psychology. The shape of a candlestick can tell you a lot about the emotions driving the market. For example, a long-bodied candle shows strong buying or selling pressure, while a short-bodied candle suggests indecision. Wicks can show how high or low the price went before being pushed back, indicating areas of support or resistance. Certain patterns, like the bullish engulfing pattern, can signal a shift in sentiment from bearish to bullish. It’s like reading the market’s mood ring!
Understanding how candlestick patterns reflect market sentiment can give you an edge in your trading. It’s not just about identifying patterns; it’s about understanding what those patterns mean in terms of buyer and seller behavior.
Key Candlestick Patterns Every Trader Should Know
Candlestick patterns are a cornerstone of technical analysis. They visually represent price movements, helping traders understand market sentiment and potential future price action. Knowing these patterns can really improve your trading game. Let’s look at some key ones.
Bullish Engulfing Pattern
The Bullish Engulfing pattern is a two-candlestick pattern that signals a potential reversal of a downtrend. It forms when a small bearish (down) candlestick is immediately followed by a large bullish (up) candlestick that completely ‘engulfs’ the previous candle’s body. This shows that buyers are stepping in and overpowering the sellers. Here’s what to look for:
- A preceding downtrend.
- A small bearish candle.
- A larger bullish candle that completely covers the bearish candle’s body.
Traders often see this as a sign to enter a long position, anticipating further price increases. It’s a pretty reliable signal when it shows up after a clear downtrend.
Bearish Engulfing Pattern
Conversely, the Bearish Engulfing pattern indicates a potential reversal of an uptrend. It’s the opposite of the bullish version. A small bullish candlestick is followed by a larger bearish candlestick that engulfs the previous candle’s body. This suggests that sellers are taking control, potentially leading to a price decline. Spotting this bearish signal is important.
- A preceding uptrend.
- A small bullish candle.
- A larger bearish candle that completely covers the bullish candle’s body.
Traders might consider this a signal to enter a short position or exit a long position.
Doji Candlestick
The Doji is a single candlestick pattern that looks like a cross or a plus sign. It forms when the opening and closing prices are virtually equal. This shows indecision in the market. Neither buyers nor sellers are in control. The implications of a Doji depend on where it appears in a trend.
- Small or non-existent body.
- Long upper and/or lower wicks (shadows).
- Location within the existing trend is key to interpretation.
A Doji after an uptrend can signal a potential reversal, while a Doji after a downtrend might suggest a possible bottom. It’s often best to wait for confirmation from subsequent candlesticks before making a trading decision. A Doji by itself isn’t always a strong signal, but it’s a good heads-up to pay attention.
Here’s a simple table summarizing these patterns:
| Pattern | Signal | Description |
|---|---|---|
| Bullish Engulfing | Bullish | Small bearish candle engulfed by a larger bullish candle after a downtrend. |
| Bearish Engulfing | Bearish | Small bullish candle engulfed by a larger bearish candle after an uptrend. |
| Doji | Neutral/Varies | Opening and closing prices are nearly equal; signals indecision. Interpretation depends on the context. |
Understanding these basic candlestick patterns is a great starting point for any trader. They provide a quick visual way to assess market sentiment and potential price movements. Remember to always use these patterns in conjunction with other technical indicators and analysis techniques for better trading decisions.
Interpreting Candlestick Patterns for Better Trading Decisions
Candlestick patterns are more than just pretty pictures on a chart. They’re like little windows into the market’s soul, showing the tug-of-war between buyers and sellers. Learning to read them can seriously up your trading game. It’s not about blindly following every pattern, but understanding what they might be telling you about where the market is headed.
Reading Candlestick Charts
Okay, so you’ve got a candlestick chart in front of you. Now what? First, remember each candlestick represents a specific time period – could be a minute, an hour, a day, whatever. The body shows the range between the open and close price. Wicks (or shadows) show the high and low for that period. Green or white means the price closed higher than it opened (bullish), while red or black means it closed lower (bearish). It’s like a visual language, and once you get the basics, you can start to see the story the market is telling. For a more detailed description, check out stock charts.
Identifying Trend Reversals
This is where candlestick patterns get really interesting. Certain patterns can signal that a trend is about to change direction. For example, a “hammer” pattern (a small body with a long lower wick) after a downtrend can suggest that buyers are stepping in and a reversal might be coming. Similarly, a “shooting star” (small body, long upper wick) after an uptrend can hint at a potential bearish reversal. It’s not a guarantee, but it’s a clue. Always look for confirmation from other indicators before making a move.
Confirming Market Momentum
Candlesticks aren’t just for spotting reversals; they can also help confirm the strength of an existing trend. A series of long, green candlesticks, for instance, suggests strong buying pressure and that the uptrend is likely to continue. Conversely, a string of red candlesticks indicates strong selling pressure. Look for patterns that support the current trend to increase your confidence in your trading decisions. Remember, no indicator is perfect, but candlesticks can be a valuable tool in your arsenal.
Candlestick patterns are most effective when used in conjunction with other forms of technical analysis. Relying solely on candlestick patterns can lead to false signals and poor trading decisions. Always consider the broader market context and confirm signals with other indicators before acting.
Limitations of Candlestick Patterns in Trading
Candlestick patterns are a great tool, but they aren’t perfect. It’s important to understand where they fall short so you don’t rely on them blindly. Think of them as one piece of a larger puzzle, not the whole picture.
False Signals in Volatile Markets
One of the biggest problems with candlestick patterns is that they can generate false signals, especially when the market is all over the place. Volatility can cause patterns to appear that don’t actually indicate a real trend or reversal. Imagine a stock price jumping up and down erratically – you might see a bullish engulfing pattern one minute and a bearish harami the next, leading to confusion and bad trades. It’s like trying to read a map during an earthquake; the landmarks keep shifting.
Need for Confirmation with Other Indicators
Candlestick patterns shouldn’t be used in isolation. They provide a snapshot of price action, but they don’t tell the whole story. You need to confirm what the candlesticks are suggesting with other technical indicators. For example, if you see a hammer pattern, which suggests a potential bullish reversal, check the Relative Strength Index (RSI) to see if the asset is oversold. Also, consider looking at moving averages to see if the price is about to cross above a key resistance level. Using multiple indicators can help filter out false signals and increase the probability of a successful trade. The best Forex broker will provide you with all the tools you need.
Timeframe Inconsistencies
The timeframe you’re looking at can significantly impact how a candlestick pattern appears and what it means. A pattern that looks like a strong buy signal on a 5-minute chart might be completely different on a daily chart. This is because shorter timeframes are more susceptible to noise and short-term fluctuations. If you’re a day trader, you might focus on shorter timeframes, but if you’re a swing trader, you’ll probably want to look at daily or weekly charts. It’s important to choose a timeframe that aligns with your trading style and to be consistent with the timeframe you use for analysis.
Think of candlestick patterns as clues, not guarantees. They can provide valuable insights into market sentiment, but they should always be used in conjunction with other forms of analysis and a healthy dose of skepticism. Don’t let the allure of a perfect-looking pattern cloud your judgment. Always consider the broader market context and manage your risk accordingly.
Combining Candlestick Patterns with Technical Indicators

Candlestick patterns are great for getting a quick read on market sentiment, but they aren’t perfect on their own. Think of them as a first impression – useful, but you need more information before making a decision. That’s where technical indicators come in. By combining candlestick patterns with other indicators, you can filter out false signals and increase the probability of successful trades. It’s like having a second opinion to confirm your initial assessment.
Using Moving Averages
Moving averages are one of the simplest, yet most effective, indicators to pair with candlestick patterns. A moving average smooths out price data to create a single flowing line, making it easier to identify the overall trend. When a bullish candlestick pattern appears above a rising moving average, it strengthens the buy signal. Conversely, a bearish pattern below a falling moving average reinforces the sell signal. For example, if you see a bullish engulfing pattern and the price is above the 50-day moving average, that’s a stronger signal than if the price is below it. You can also use moving averages as dynamic support and resistance levels.
Integrating RSI with Candlestick Patterns
The Relative Strength Index (RSI) is a momentum indicator that measures the magnitude of recent price changes to evaluate overbought or oversold conditions in the price of a stock or other asset. RSI values range from 0 to 100. An RSI above 70 typically indicates an overbought condition, while an RSI below 30 suggests an oversold condition. Combining RSI with candlestick patterns can help confirm potential reversals. For instance, if you spot a hammer candlestick pattern in an oversold market (RSI below 30), it could signal a strong buying opportunity. However, it’s important to remember that RSI can remain in overbought or oversold territory for extended periods, especially in strong trending markets. So, look for divergence between price and RSI for even stronger signals. For example, if the price is making new highs, but the RSI is making lower highs, that could be a sign of weakening momentum and a potential reversal.
Volume Analysis for Confirmation
Volume is a critical piece of the puzzle that often gets overlooked. It represents the number of shares or contracts traded during a specific period. High volume during a candlestick pattern formation can validate the pattern’s strength, while low volume might suggest a weaker signal. For example, a bullish engulfing pattern accompanied by a significant increase in volume is a more reliable indicator of a potential uptrend than one with average or below-average volume. Volume can also help confirm breakouts. If the price breaks above a resistance level on high volume, it’s a stronger signal that the breakout is genuine and likely to continue. Conversely, a breakout on low volume might be a false breakout, so be cautious. You can learn more about how to read stock charts to improve your analysis.
Combining candlestick patterns with technical indicators isn’t about finding the perfect formula. It’s about increasing the odds of success by using multiple tools to confirm your trading decisions. Each indicator provides a different perspective on the market, and by integrating them, you can gain a more complete and nuanced understanding of price action.
Here’s a simple table illustrating how different indicators can confirm candlestick patterns:
| Candlestick Pattern | Indicator | Confirmation Signal |
|---|---|---|
| Bullish Engulfing | Moving Average | Pattern forms above a rising moving average |
| Bearish Engulfing | RSI | Pattern forms in overbought territory (RSI > 70) |
| Hammer | Volume | High volume during the hammer’s formation |
| Shooting Star | Trendline | Pattern forms at a key resistance level/trendline |
Remember, no indicator is foolproof, and it’s essential to use risk management techniques to protect your capital. Here are some key points to remember:
- Don’t rely solely on candlestick patterns. Use them in conjunction with other indicators and analysis techniques.
- Consider the market context. Candlestick patterns are more effective in certain market conditions than others.
- Practice proper risk management. Always use stop-loss orders and manage your position size appropriately.
Market Conditions Favorable for Candlestick Analysis
Effectiveness in Trending Markets
Candlestick patterns really shine when the market is clearly moving in one direction. In a strong uptrend, bullish patterns can signal good entry points for buying, while in a downtrend, bearish patterns can help identify opportunities to sell or short. Think of it like this: if a stock is already going up, a bullish candlestick pattern is like a little extra nudge confirming that upward momentum. It’s not a guarantee, but it adds weight to the idea that the trend will continue. This is where market resilience becomes really apparent.
Challenges in Sideways Markets
Sideways markets, also known as ranging markets, are a different beast altogether. In these conditions, prices bounce around within a relatively narrow range, making it tough to predict which way they’ll go next. Candlestick patterns can become less reliable because the signals they give might be contradictory or just plain confusing. You might see a bullish pattern one day and a bearish pattern the next, leading to analysis paralysis. It’s like trying to navigate with a compass that’s spinning in circles. In these situations, it’s best to be cautious and consider using other technical indicators to get a clearer picture.
Adapting Strategies to Market Conditions
To make candlestick analysis work for you, it’s important to adjust your approach based on what the market is doing. In trending markets, you can be more aggressive in acting on candlestick signals. However, in sideways markets, it’s often better to wait for more confirmation or to use different strategies altogether. For example, you might focus on range-bound trading techniques or simply stay on the sidelines until a clear trend emerges. Think of it as being a chameleon – adapting to your surroundings to survive and thrive. Also, remember to check out swing trader strategies for longer-term trends.
It’s important to remember that no trading strategy is foolproof, and candlestick analysis is no exception. Market conditions can change quickly, and what works one day might not work the next. That’s why it’s crucial to stay flexible, keep learning, and always manage your risk carefully.
Educational Resources for Mastering Candlestick Patterns
Top Trading Books for 2025
Want to really get good at using candlestick patterns? Books are still a great way to learn. Reading about it can be different than seeing it on a screen. Here are a few books that people seem to like:
- Japanese Candlestick Charting Techniques by Steve Nison: This is like the bible for candlestick stuff. A lot of people start here.
- The Candlestick Course by Steve Nison: If you like Nison’s first book, this one goes even deeper.
- Encyclopedia of Chart Patterns by Thomas Bulkowski: This one isn’t just about candlesticks, but it covers a ton of patterns, so it’s good to have around.
- Trading for a Living by Dr. Alexander Elder: It touches on candlestick patterns, but it’s more about the psychology of trading, which is super important.
- Profitable Candlestick Trading by Stephen Bigalow: Focuses on how to actually make money using these patterns.
It’s easy to get overwhelmed by all the information out there. Start with one or two books that seem interesting, and really try to understand the concepts before moving on to more advanced stuff.
Online Courses and Webinars
Okay, so maybe books aren’t your thing. That’s cool. There are tons of online courses and webinars about candlestick patterns. The good thing about these is that they’re usually more interactive, and you can ask questions. The key is to find a reputable source.
Here’s what to look for:
- Instructors with a solid background in trading.
- Courses that cover a range of patterns, not just the popular ones.
- Reviews from other traders.
- A clear explanation of how to use candlestick patterns in real-world trading scenarios.
Trading Communities and Forums
Don’t underestimate the power of talking to other traders. Trading communities and forums can be a goldmine of information. You can ask questions, share your own experiences, and learn from others. Plus, it’s good to know you’re not alone in this crazy world of trading!
Some popular places to check out:
- Online trading forums (just search for “trading forum” and you’ll find a bunch).
- Social media groups dedicated to trading.
- Local trading meetups (if you’re lucky enough to have one in your area).
Just remember to take everything you read with a grain of salt. Not everyone online is an expert, so do your own research before making any trading decisions.
Wrapping It Up
So, there you have it. Getting a grip on candlestick patterns can really change the game for your trading in 2025. By spotting and understanding these patterns, you can get a better idea of where the market might head next. This means you can manage your risks more wisely and jump on good trading chances when they pop up. Just remember, while these patterns are helpful, they’re not foolproof. Always keep an eye on the bigger picture and use other tools to back up your decisions. Happy trading!
Frequently Asked Questions
What are candlestick patterns?
Candlestick patterns are visual tools used in trading that show how prices move over time. Each candlestick represents the opening, closing, highest, and lowest prices during a specific time.
Why are candlestick patterns important?
These patterns help traders understand market trends and make better decisions. They can signal when prices might go up or down.
What is a bullish engulfing pattern?
A bullish engulfing pattern happens when a small red candlestick is followed by a larger green one. This often means that prices may rise.
Can candlestick patterns give false signals?
Yes, sometimes candlestick patterns can be misleading, especially in fast-moving markets. It’s important to use them with other tools for better accuracy.
How can I use candlestick patterns with other indicators?
You can combine candlestick patterns with tools like moving averages or the Relative Strength Index (RSI) to confirm signals and make more informed trading choices.
Where can I learn more about candlestick patterns?
There are many resources available, like books, online courses, and trading communities. Some recommended books include ‘Japanese Candlestick Charting Techniques’ by Steve Nison.